Is Strength of Schedule real or imagined?
by Ian Simcox
In my time looking at NFL stats I’ve seen many comments along the lines that Strength of Schedule is something fans of losing teams moan about. “It doesn’t matter who you’re against”, they say, “you should just beat them”. But how much effect does SoS actually have? To begin to answer this, I have looked at the 2009 season.
I firstly need to use some kind of rating system for each team, which I will then use to work out the win probabilities for each game. Once I know how the ratings turn into wins, I can compare each team’s actual schedule with a theoretical ‘average’ schedule (which I’ve defined as playing a game against each team, including self) to see how many expected wins are gained/lost from having different opponents.
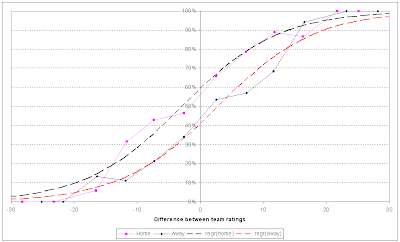
For the rating system I used a variant of PFR’s Simple Rating System, using points difference to rank each team (plus adjustments using a regression to account for opponents, if anyone’s interested in the data I’ll post it on request). With the team ratings produced I then needed to look at each game and, using a binary logistic regression, produced a figure to estimate win probabilities based on rating differences of each team plus a dummy variable for venue. The results for that regression are shown below, with the pink line being the raw data for home sides, the blue the raw for away and the black/red dashed lines the home/away win probabilities resulting from the regression.
Now that I’ve got that, I can go through each team’s schedule and calculate how many wins we’d expect, based on that team’s and their opponents’ strength (in the table below, this is under the column EXP_W). Similarly, we can look at the win probabilities for each team against all other teams and convert that into an expected number of wins in a 16 game season on a ‘average’ schedule (column EXP_WvA).
The ‘Diff’ column then represents how many wins were gained/lost by each team solely on their schedule. To read the table, we see that Arizona’s schedule meant we’d have expected them to win 9.2 games (they actually won 10 in 2009). Had they been given a more balanced schedule, we’d have expected them to win 7.8 games, which means their schedule gave them 1.4 wins (the joys of playing in the NFC West). Atlanta fans can feel a bit aggrieved that they didn’t make the playoffs last season, as they finished two wins behind Green Bay on a schedule that was two wins harder.
NB – numbers may not add due to rounding
In summary then, it seems that your schedule can make quite a large difference to your season, being worth up to 2 wins/losses in extreme cases. Will this stop people dismissing people who point out strength of schedule as moaners? Probably not, but at least now you’ll know you were right.


3 comments:
nice article. to clarify the y-axis, the ordered pair, (-23, 0) on pink line would mean that anytime a team (I suspect maybe once all year) played another team and had a value of -23 less than opponent (the difference), they lost (since 0%). is that correct?
Yes, that's correct. The y-axis is win percentage.
Ian, I am the dean of the Honors Program at San Jacinto College in Houston, TX. We are hosting a math camp this summer for high school students and I would like to invite the statistician for the Houston Texans to speak to our participants. Do you know how to contact them? The only number I can find is for their box office.
Post a Comment
Note: Only a member of this blog may post a comment.