by Michael Beuoy
Here are the week 14 betting market power rankings. Here is a link to the first set of rankings I generated last week.
First off, thanks to Brian for making the Community site available as well as calling out last week’s post on the main blog. There was a lot of good feedback in the comments section. Most of it I’m still chewing over, but I have decided to incorporate a suggestion from Jim A, who has been creating a very similar set of rankings over at Nutshellsports.com. More on that later.
Methodology
The original post has more detail, but here’s an overview:
The goal I had was to generate a set of point-based rankings that would best predict how the betting market would set the point spread for the coming week’s matchups. The better I was able to match the point spread, the better the rankings were a reflection of the market’s estimate of team by team strength. Through trial and error experimentation, I found that using point spreads for the most recent five weeks (with higher weighting given to more recent weeks), combined with an adjustment that accounted for actual game outcomes, generated the best predictive accuracy. More detail here.
Wednesday, December 7, 2011
| [+/-] |
Betting Market Power Rankings – Week 14 |
Friday, December 2, 2011
| [+/-] |
Betting Market Power Rankings |
by Michael Beuoy
The purpose of this post is to use the point spreads from recent weeks of the season to derive an implied power ranking. Basically, the point is to try to figure out what the betting market thinks are the best and worst teams in the NFL. From a broader perspective, I hope to provide insight into how the betting market “thinks” in general. One result that emerged from this analysis was a measure of how much the betting market reacts to the result of a particular game.
The challenge in deriving a power ranking from the point spreads is that the point spread only tells you the relative strength of the two teams. For example, Green Bay is favored by 7.0 points on the road against the NY Giants this week. We know that home teams are favored on average by 2.5 points, so after removing the home team bias, the betting market appears to think that Green Bay is 9.5 points better than the Giants. New England is favored by 21(!) points at home against Indianapolis So the betting market thinks that New England is 18.5 points better than Indianapolis.
Wednesday, November 9, 2011
| [+/-] |
Adjusting Strength of Schedule |
 by Michael Beuoy
One of the more interesting components (to me) of Brian Burke's efficiency model is the strength of schedule adjustment. I found it interesting the way you could bootstrap yourself into a self-consistent opponent adjustment. Here is the description (link):
"To adjust for opponent strength, I could adjust each team efficiency stat according to the average opponents’ corresponding stat. In other words, I could adjust the Cardinals’ passing efficiency according to their opponents’ average defensive efficiency. I’d have to do that for all the stats in the model, which would be insanely complex. But I have a simpler method that produces the same results.
Tuesday, November 1, 2011
| [+/-] |
Peyton Manning - Colts Defensive MVP?? |
 by Steven Buzzard
A growing sentiment that has started to crop up with a lot of the talking heads in the league is that the Colts would be pretty terrible if Peyton Manning was playing because the defense has been so atrocious. These same people love to state the obvious and point out that Peyton Manning doesn’t make tackles. However, a lot of stats analysts have known over the years that the Colts offense has actually helped the Colts defense in 3 key ways.
1) They stay on the field a long time and limit the total number of drives per game
2) By staying on the field they give the defense great field position despite terrible special teams
3) By getting leads the defense can force more turnovers
Thursday, October 13, 2011
| [+/-] |
MRE - Measure of Random Events through week 5 |
by Bruce D
MRE = (good luck points)-(bad luck points), so positive numbers are the luckiest teams.
For a more in-depth explanation of what "luck" points are, go to a previous post here.
If random events can't be repeated, then past points due to MRE can NOT be considered as being due to skill. Likewise, past performance due to MRE can't be included in analyzing future performance. In a nutshell, "lucky" teams can't be expected to be so "lucky", and "unlucky" teams are better than we may think.
Points for(+) the lucky team, are the same amount of points against(-) the unlucky team.
MRE is valued as follows:
punts blocked=3
interceptions=2.5
fumbles lost=2.5
field goal miss/block=2.5
punt returns for a TD=4.5
ko returns for a TD=4.5
| [+/-] |
NFL QBR Differential after week 5 |
by Jeff Anderton
After reading several articles about Passer Rating Differential being the most relevant stat correlated to winning NFL football games, I decided to see what the current year to date QBR Differentials were for the NFL. For those that don't know, QBR is the "new" rating that ESPN developed and introduced this summer(2011). ESPN was looking to build off the "traditional" passer rating formula and take into account specific things that happen during a play.
For example, a QB makes a bad pass on a 5 yard "out route" but the receiver makes amazing catch, the Defensive Back falls down, and the receiver then turns it up field for a 30 yard gain. Under the QBR system the QB would not get as many "points" for this play since he made a bad throw, the DB fell down, there were a lot of yards after the catch, and the receiver made an amazing catch. There are also factors that figure out how to differentiate between "garbage time" and clutch scenarios, taking into account the current score, time left in the game, type of defense being used(prevent defense dink and dumps score low), etc.
So with that quick background behind us, lets take a look at what I did to compile these numbers. I took the individual QBR rating for each teams opponent for every week of the year, then simply added them up and divided by games played. I then took the team's own QBR rating(what their man under center scored for the year so far) and subtracted what they "got" from what they "gave up". Nothing major here in terms of math, just some down and dirty research.
For games that involved teams who used 2 QB's I simply added both ratings together for that game and divided by 2. I realize there could be some flaws with this method if we look at it from a "weighted performance perspective", but it would be such a small variance I don't think it much matters.
Not a whole lot of suprises as most of the good teams are at the top and the bad teams are at the bottome, but still interesting to see where a few teams fell. I was surprised that the Texans and Eagles were this high, and also surprised that the Jets, Bears, Falcons and Redskins were this low. These numbers are through and including week 5 and account for teams that had a bye week already.
Team by Team QBR Differential through and including week 5 of the 2011 NFL Season
| Team | QB Differential |
| Cowboys | 47.56 |
| Packers | 43.48 |
| Titans | 42.2 |
| Saints | 37.96 |
| Bills | 32.48 |
| Texans | 30.84 |
| Lions | 30.12 |
| Patriots | 29.76 |
| Chargers | 29.37 |
| Panthers | 24.12 |
| Eagles | 22.52 |
| Giants | 19.78 |
| Broncos | 18.79 |
| Ravens | 14.27 |
| Steelers | 13.62 |
| Raiders | 12.36 |
| Chiefs | 10.84 |
| 49ers | 10.32 |
| Falcons | 9.2 |
| Bucs | 6.72 |
| Browns | 2.54 |
| Redskins | 2.02 |
| Bengals | 0.95 |
| Jets | -4.22 |
| Vikings | -5.12 |
| Seahawks | -6.73 |
| Bears | -8.14 |
| Cardinals | -15.24 |
| Jaguars | -15.78 |
| Dolphins | -18.8 |
| Colts | -28 |
| Rams | -35.98 |
Saturday, October 8, 2011
| [+/-] |
Joe's numbers, and the moral of the story |
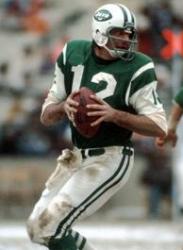 Appreciating how the Old Ones played. Or: Joe Namath in the 2000s. Part III -- by Jim Glass.
Part I explained what is going on here and why. Part II presented the statistical background behind this comparison of the 1970s and 2000s.
Namath in the 2000s
"Namath's numbers were shockingly bad. You tend to remember Namath as this seminal figure, and of course he was, and then you see those stats and just go: 'Yuck.'" -- Joe Posnanski, Sports Illustrated.
This has become a popular notion among many football fans who never saw Namath play, and who have a little knowledge of football statistics - but not enough.
"Joe Namath is in the Hall of Fame because of his celebrity - getting a big contract, winning one famous game, being the first pro football player to wear pantythose in public - not for achievements on the football field." - comment at Football Outsiders.

 Posts
Posts


